
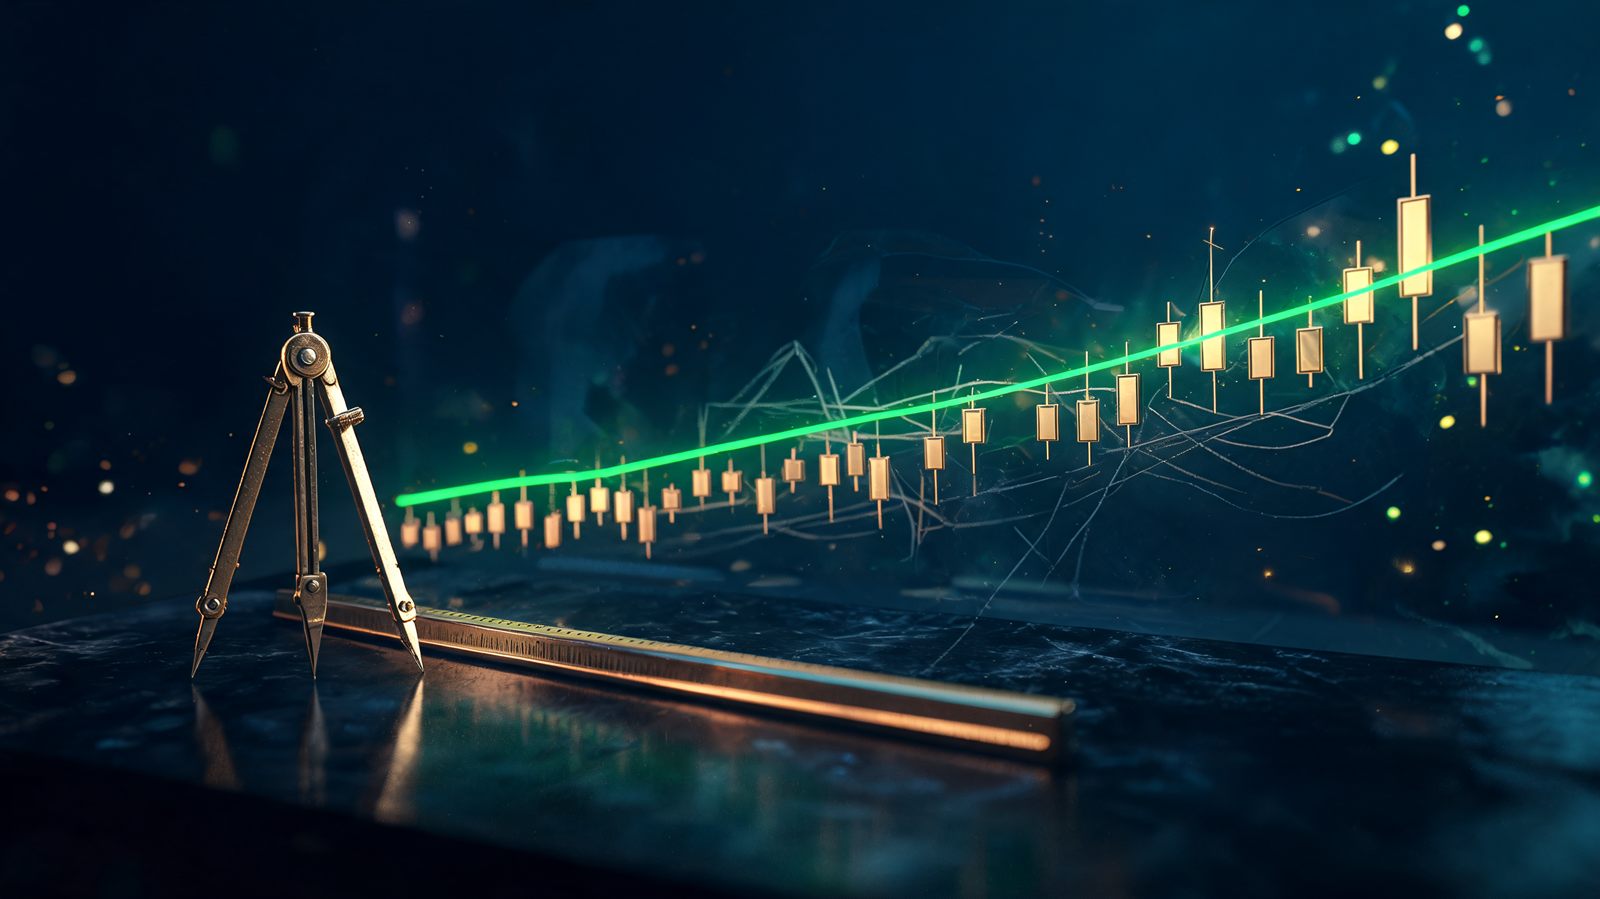
To draw a trendline, connect two swing lows in an uptrend — or two swing highs in a downtrend — and extend the line forward. The second point defines the line; the third touch is what validates it. If you have to force the line through candle bodies to make it fit, the trendline is not there.
Almost every trendline argument is really an argument about honesty. The line itself is trivial to draw. What is hard is drawing the line the chart is showing you rather than the line that supports the position you already want to take. Everything below is a rule designed to make that harder to do by accident.
What a trendline actually is
A trendline is a claim about the rate of change of a market, not about a price. Horizontal support and resistance says buyers appeared at 100 and may appear there again. A trendline says buyers appeared at successively higher prices, at a roughly constant rate, and may keep doing so. That is a much stronger claim, which is why it needs more evidence before you act on it.
It follows that a trendline has an expiry built into it. A horizontal level can sit untouched for months and still be valid the moment price returns. A rising trendline is only meaningful while the pace of the advance holds. A market can remain in a perfectly healthy uptrend and still break a trendline simply because it slowed down — and traders who treat the break as a reversal signal get short into an intact trend on a regular basis.
How to draw a trendline: five steps
- Zoom out and name the trend first. Higher highs and higher lows means you draw beneath the lows. Lower highs and lower lows means you draw above the highs. If the chart is doing neither, do not draw a trendline — you are in a range, and a horizontal level is the right tool.
- Find the two anchor swing points. Use obvious pivots, the ones a stranger would point to. A swing low is a candle low with higher lows on both sides of it; the more candles either side, the more significant the pivot.
- Connect them and extend to the right. The line's job is entirely in front of price. What it does behind price is only a check on whether it was drawn honestly.
- Check that price has not traded through it in between. If the line slices through candles between your two anchors, the slope is wrong. Re-anchor on different pivots rather than nudging the line.
- Wait for the third touch. The first two points are a hypothesis. The third touch is the market agreeing with you, and it is the earliest point at which the line is evidence rather than decoration.
Wicks or bodies?
Connect wicks, and treat the result as a narrow band rather than a single price. The case for bodies is that wicks are noise. They are not — a wick is a record of real transactions at that price, and a line drawn through bodies will sit inside territory price has already traded. When your line is inside the range, every subsequent test looks like a break.
The practical version: anchor on the extremes, then allow a tolerance of a few ticks either side and apply that tolerance to every chart you draw. Consistency matters more than which convention you pick. A trader who always uses wicks and a trader who always uses bodies will both build a usable read of the market. A trader who switches depending on which one makes the current chart look better has no method at all.
How many touches before it is worth trading
Three is the working minimum, and the reason is mechanical rather than mystical. Two points can be connected on any chart in existence — randomness produces two-point lines constantly. A third touch means price returned to a specific, forward-projected price at a specific time and turned away from it. That is a genuinely different event, and it is the first piece of evidence that other participants are working from the same slope you are.
Beyond three, more touches cut both ways. A line with six clean touches is widely watched, which makes reactions there more reliable. It is also increasingly likely to be broken, because each successive test consumes some of the resting orders defending it. Steep lines in particular — anything much beyond about 45 degrees on a normally-scaled chart — describe a pace of advance that cannot continue and tend to break early, without the trend itself reversing.
When is a trendline broken?
When a candle closes beyond the line on the time frame you drew it on. Not when a wick pierces it, not when price trades through it intrabar, and not when it looks broken while the candle is still forming. A wick through a trendline is a test — that is the line doing its job. A close beyond it means the participants who had been defending that slope have stopped defending it.
This is the same standard covered in break and hold confirmation, and applying it to trendlines removes most false alarms in one change. The break of an up-trendline also means less than most traders assume: the immediate implication is that the rate of advance has changed, not that the direction has. Confirmation that the trend has actually turned comes from structure — a lower high after the break — not from the break itself.
The errors that make trendlines useless
| Error | What it looks like | The fix |
|---|---|---|
| Fitting to a view | You redraw until the line supports the trade you wanted | Draw before you have a position or an opinion, and leave it |
| Two-point trading | Entering at the first return to an unvalidated line | Require the third touch before the line informs a trade |
| Chart clutter | Every pivot connected to every other pivot | Two or three lines maximum; delete the rest |
| Steep lines | A near-vertical line off a parabolic move | Treat as a pace gauge, not a reversal trigger |
| Wick-based breaks | Reacting before the candle closes | Judge every break on the close |
| Mixed conventions | Wicks on one chart, bodies on the next | Pick one and apply it everywhere |
Log scale or linear scale
On short intraday charts it makes no visible difference and you can ignore it. On anything spanning a large percentage move — a multi-year stock chart, a crypto chart — it changes the answer completely. A linear scale gives equal vertical space to equal dollar moves, so a trendline drawn on it steepens misleadingly as price rises. A logarithmic scale gives equal space to equal percentage moves, which is how returns actually compound. For long-horizon charts, draw on log. The important part is that you know which one you are on, because the same two anchor points produce two different lines.
The honest limitation
The reason trendlines attract so much argument is that they are genuinely subjective, and finance academics have spent decades trying to remove that subjectivity to test whether the shapes mean anything. Lo, Mamaysky and Wang built an automated pattern-recognition method using nonparametric kernel regression specifically to take the human eye out of it, then ran it across a large sample of U.S. stocks over the 31-year period from 1962 to 1996. Their finding was measured rather than triumphant: comparing the unconditional distribution of daily returns against the distribution conditioned on technical patterns, "several technical indicators do provide incremental information and may have some practical value" (Lo, Mamaysky & Wang, "Foundations of Technical Analysis", NBER Working Paper 7613, later Journal of Finance 55(4), 2000, pp. 1705–1765).
Read that carefully, because it is the correct expectation to hold. Incremental information is not an edge on its own — it is a small tilt that has to be paired with risk control before it means anything to your account. A trendline is a place to look, a way of organising a chart, and a source of a clean invalidation price. It is not a signal, and no amount of care in drawing it makes it one.
Frequently Asked Questions
How many points do you need to draw a trendline?
Two points draw the line and the third touch validates it. With two swing lows you have a hypothesis: the market may be respecting a rising floor. Until price returns to that line and turns away from it, you have no evidence that anyone else is watching. Most traders act on the two-point line and then wonder why it failed; the third touch is what turns a drawn line into an observed one.
Should trendlines connect wicks or candle bodies?
Connect wicks and treat the line as a zone rather than a single price. Wicks are real transactions, not noise, and a line drawn through bodies will sit inside the range that price has already traded through. The practical compromise is to anchor on the extremes and accept a band a few ticks wide, then apply the same rule to every chart so your lines are comparable to each other.
When is a trendline actually broken?
When a candle closes beyond the line on the time frame you drew it on, not when a wick pierces it intrabar. A wick through a trendline is price testing it, which is the line doing its job. A close beyond it means the participants who were defending that slope have stopped. Judging the break on the close is the single change that removes most trendline false alarms.
Do trendlines actually work, or are they self-fulfilling?
Both descriptions can be true at once, and neither guarantees anything. A trendline works when enough participants see the same slope and act on it, which is why obvious lines on higher time frames matter more than clever ones on a five-minute chart. It fails when it is drawn to fit a view rather than to describe the chart. Treat a trendline as a place to look, never as a reason to trade on its own.
Bottom line
Name the trend, anchor on two obvious pivots, extend the line forward, and wait for a third touch before you let it influence a decision. Connect wicks, keep two or three lines on the chart at most, judge every break on the close, and remember that a broken up-trendline reports a change of pace rather than a change of direction. The line's real value is not prediction — it is that it gives you a defined price at which your read is wrong. Build from there with technical analysis basics, then work out what separates a real breakout from a fake one before you trade the line at all.